2021 Winter Forecast and Climate Trends
Dec. 1 marks the start of meteorological winter, and that brings about the number one question to meteorologists everywhere: What will winter be like this year?
Obviously, we can’t provide a perfect forecast, but we can give an idea based on previous years and worldwide climate patterns. Below is a look at the latest winter outlooks from the Climate Prediction Center. These maps hint at higher confidence in above normal temperatures and precipitation over the next three months for much of Kentucky. This DOES NOT mean the entire winter will be warm and wet. We’ll still have some bouts of cold air and dry periods, but when looking at the winter as a whole, forecasters hint that the wet and warm periods will outweigh those drier and cooler periods. A sliver of Southeastern Kentucky is even in the "equal chance" category, meaning that chances are equal for near, above, and below normal precipitation.
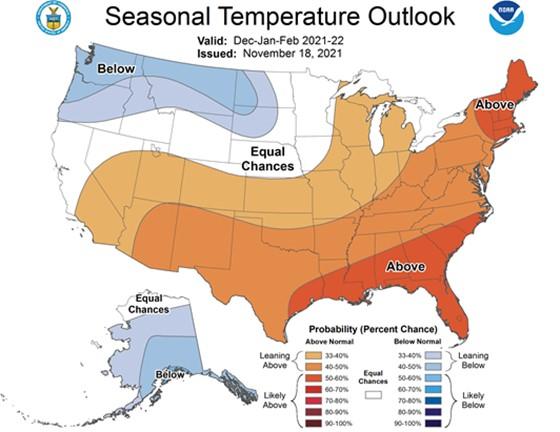
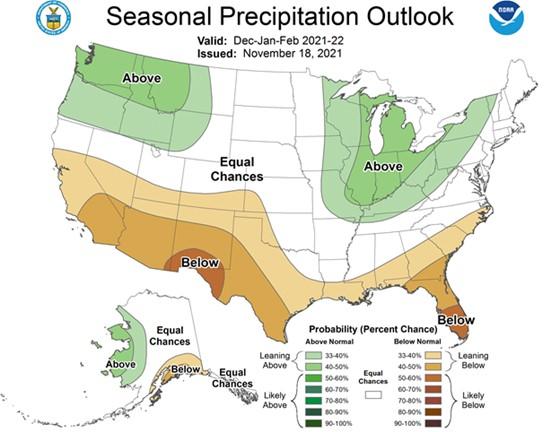
Darker shades on the maps above correlate to higher confidence. You can see that the shades across Kentucky aren’t the darkest. This indicates the uncertainty in the forecast. The focus this year is on a “double-dip La Nina,” meaning this is the second year in a row for La Nina conditions over the winter months.
"La Nina" is associated with the El Nino-Southern Oscillation (ENSO) climate pattern. The Southern Oscillation can take one of three phases: neutral, El Nino or La Nina. El Nino and La Nina phases are known for causing disruptions to large-scale weather patterns, such as the jet stream, most significantly during the winter months. La Nina is the cool phase and is associated with cooler sea surface temperatures in the equatorial Pacific Ocean. Below is a look at the conditions we expect across the United States during a typical La Nina winter. Here in the Ohio Valley, we typically see warmer and wetter conditions during a La Nina. Notice that this map is quite similar to the outlooks.
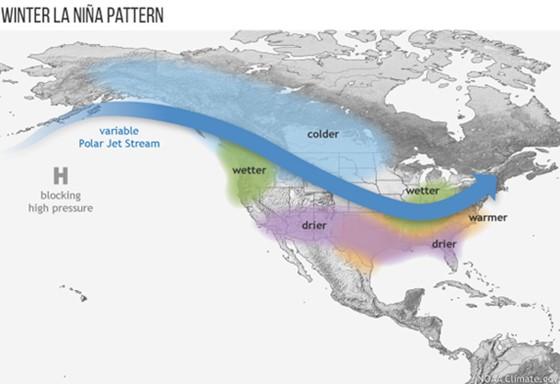
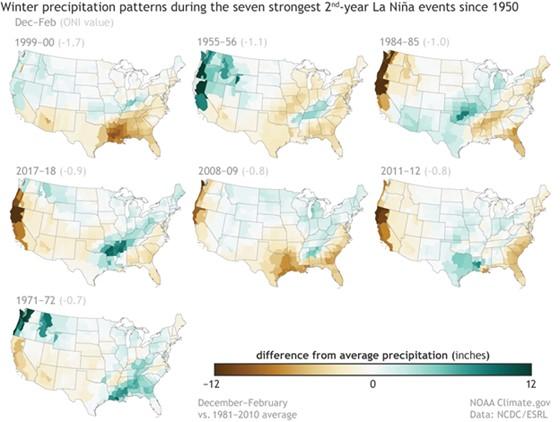
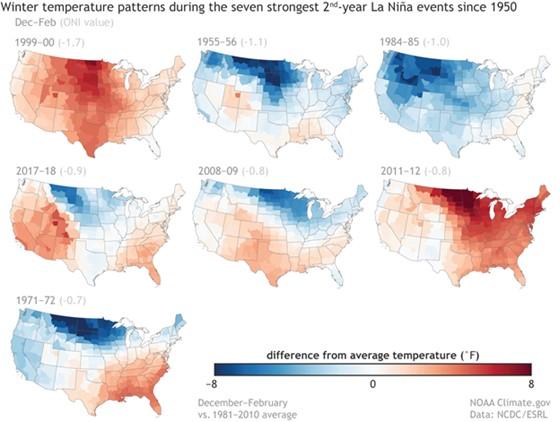
The problem is that La Nina for winter 2021-22 is considered "weak.” So, the map above will most likely have deviations, which complicates the winter forecast further. The map above is most probable during “strong” events. I recently read a great article from Mike Halpert, deputy director of the NOAA Climate Prediction Center, which discussed winter precipitation and temperature patterns associated with the second year of a double-dip La Nina.
I included a look at the maps developed by climate.gov below. Most, but not all, of the time, we see wetter than normal winters in the Bluegrass State with a double-dip La Nina. Warmer winters have also been more prevalent than cooler winters. One caveat he pointed out: We don’t have a lot of data on these double-dip La Nina episodes, since they have only happened seven times since 1950.
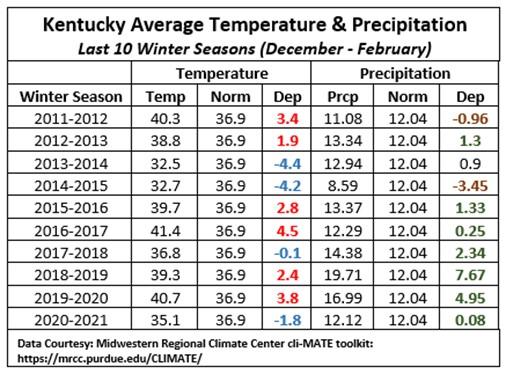
Our winters have been trending warmer and wetter over the past decade. This makes the warmer and wetter outlook a familiar scenario. Using data from the Midwestern Regional Climate Center, I've looked at the temperature and precipitation statistics over the past 10 winters. Since our exceptionally cold winter of 2014-15, five of our past six winters have seen near to above normal temperatures. The only exception came this past winter when a very cold and active February pushed us solidly below normal for the season. Overall, four of the top-10 warmest winters on record (data going back to 1895) have occurred over the past decade in Kentucky. 2016-17 sits at #2, 2019-20 at #5, 2011-12 at #6, and 2015-16 at #9. Looking at precipitation, Kentucky has now seen six straight winters of above normal precipitation. Some years have been much more significant than others. 2018-19 ranked as the 4th wettest winter on record, while 2019-20 was #12.
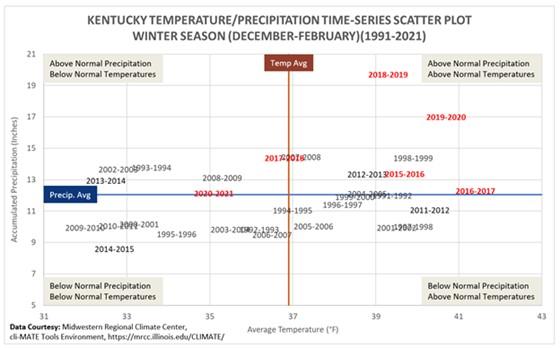
I combined these two aspects of temperature and precipitation for the past 30 years in the time-series scatter plot below. Each year is plotted based on the average winter temperature and accumulated precipitation for that respective year. The graph is then divided into four boxes based on the 1991-2020 Kentucky temperature (red line) and precipitation (blue line) normals for the winter season. Here's how to understand the chart. Upper right: Contains any years with above normal precipitation and temperatures. Upper left: above normal precipitation and below normal temperatures. Bottom left: both below normal precipitation and temperatures. Bottom right: below normal precipitation and above normal temperatures. Then I highlighted the last five years in red. Outside of this past winter, the previous five have all hovered within or very close to that upper right box of above normal precipitation and temperatures.
The warmer and wetter winters have proven impactful to Kentucky agriculture in a variety of ways. Based on the outlooks, we could be in for similar problems in winter 2021-22. Kentucky is in a good spot compared to other states in the northern plains when it comes to soil moisture, but that could come at a cost with a wetter-than-normal winter on the way.
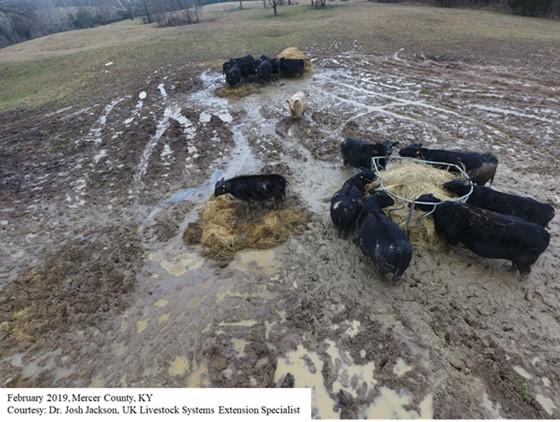
One impact could be an overwhelming amount of mud. Below is a picture from Dr. Josh Jackson, a UK extension livestock systems specialist and livestock producer in Mercer County. He took this in February of 2019, which was the second wettest February in Kentucky history when the state averaged 9.39 inches. This was one of many mud-filled scenes that were observed that year; mud has become more prevalent with warmer and wetter winters in place.
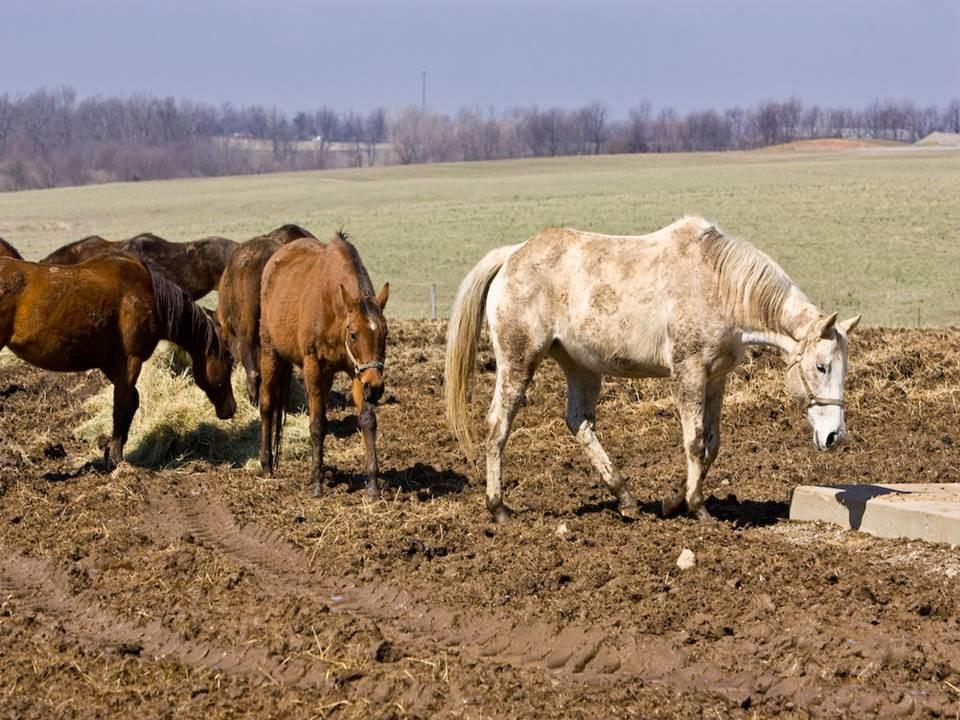
Also see the photo of horses in mud by Steve Higgins, PhD. Heavy mud can create a stressful environment for animals, causing feed requirements to go up to maintain proper body condition. Luckily, hay production was high this year, with extended dry windows that were absent in recent years, especially 2020. Also, according to the latest Kentucky Crop Progress and Condition Report on Nov. 29, livestock condition is running predominantly in the good to excellent category. Despite that, a warm and wet winter could cause livestock issues.
With the prevalence of wet conditions over recent years producers may want to consider mitigation strategies. Jackson installed all-weather surfaces on his farm, specifically in feeding areas that see a lot of foot traffic. More information on siting and materials suitable for your own operation can be found in the following extension publication, AEN-115 – Appropriate All Weather Surfaces for Livestock.
The potential for flooding also deserves monitoring. Kentucky, especially eastern portions of the state, got hit hard late last February and early March following intense rainfall across the region. Warm temperatures combined with wetter winter climates and dormant vegetation is a recipe for more runoff. Livestock producers and horse owners need to prepare for the potential for flooding during the winter season. In the Aug. 24 edition of the Ag Weather Update, I discussed several steps a producer can take to better prepare themselves for the threat of flooding. Be sure to take a look since now is the time to prepare.
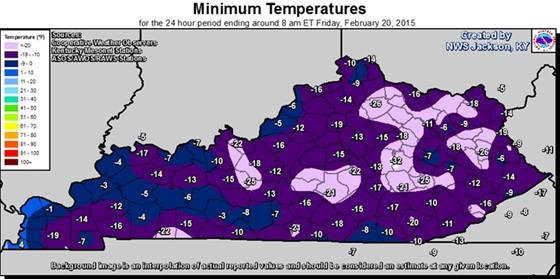
In the end, winter forecasting is definitely not an exact science. Despite outlooks hinting at above normal temperatures and precipitation across the Lower Ohio Valley, we’ll still have our ups and downs through the year. Overall, it's good news. Combined with climate trends, the outlooks do hint we are NOT in for a VERY cold winter in the Bluegrass State. My parents always told me about the winter of 1978, but the winter of 2014-15 is my '78. February 2015 was the fourth coldest February on record. The coldest temperatures were seen on Feb. 20 when several across the state dipped between 10 and 20 degrees below zero (map below from NWS Jackson, Ky.). The Richmond, Kentucky, Mesonet station dipped to -32. That was only five degrees away from tying the all-time record low for Kentucky, set in 1994 in Shelbyville. I don’t know about you, but I’ll definitely choose a warmer outlook over that kind of winter any day.
Matt Dixon, Meteorologist, UK College of Agriculture, Food and Environment.
